Community Science Program Results & Info
Volunteers collect data on Stream Temperature, Bacteria, Basic Water Quality, and Aquatic Insects
Stream Temperature Results
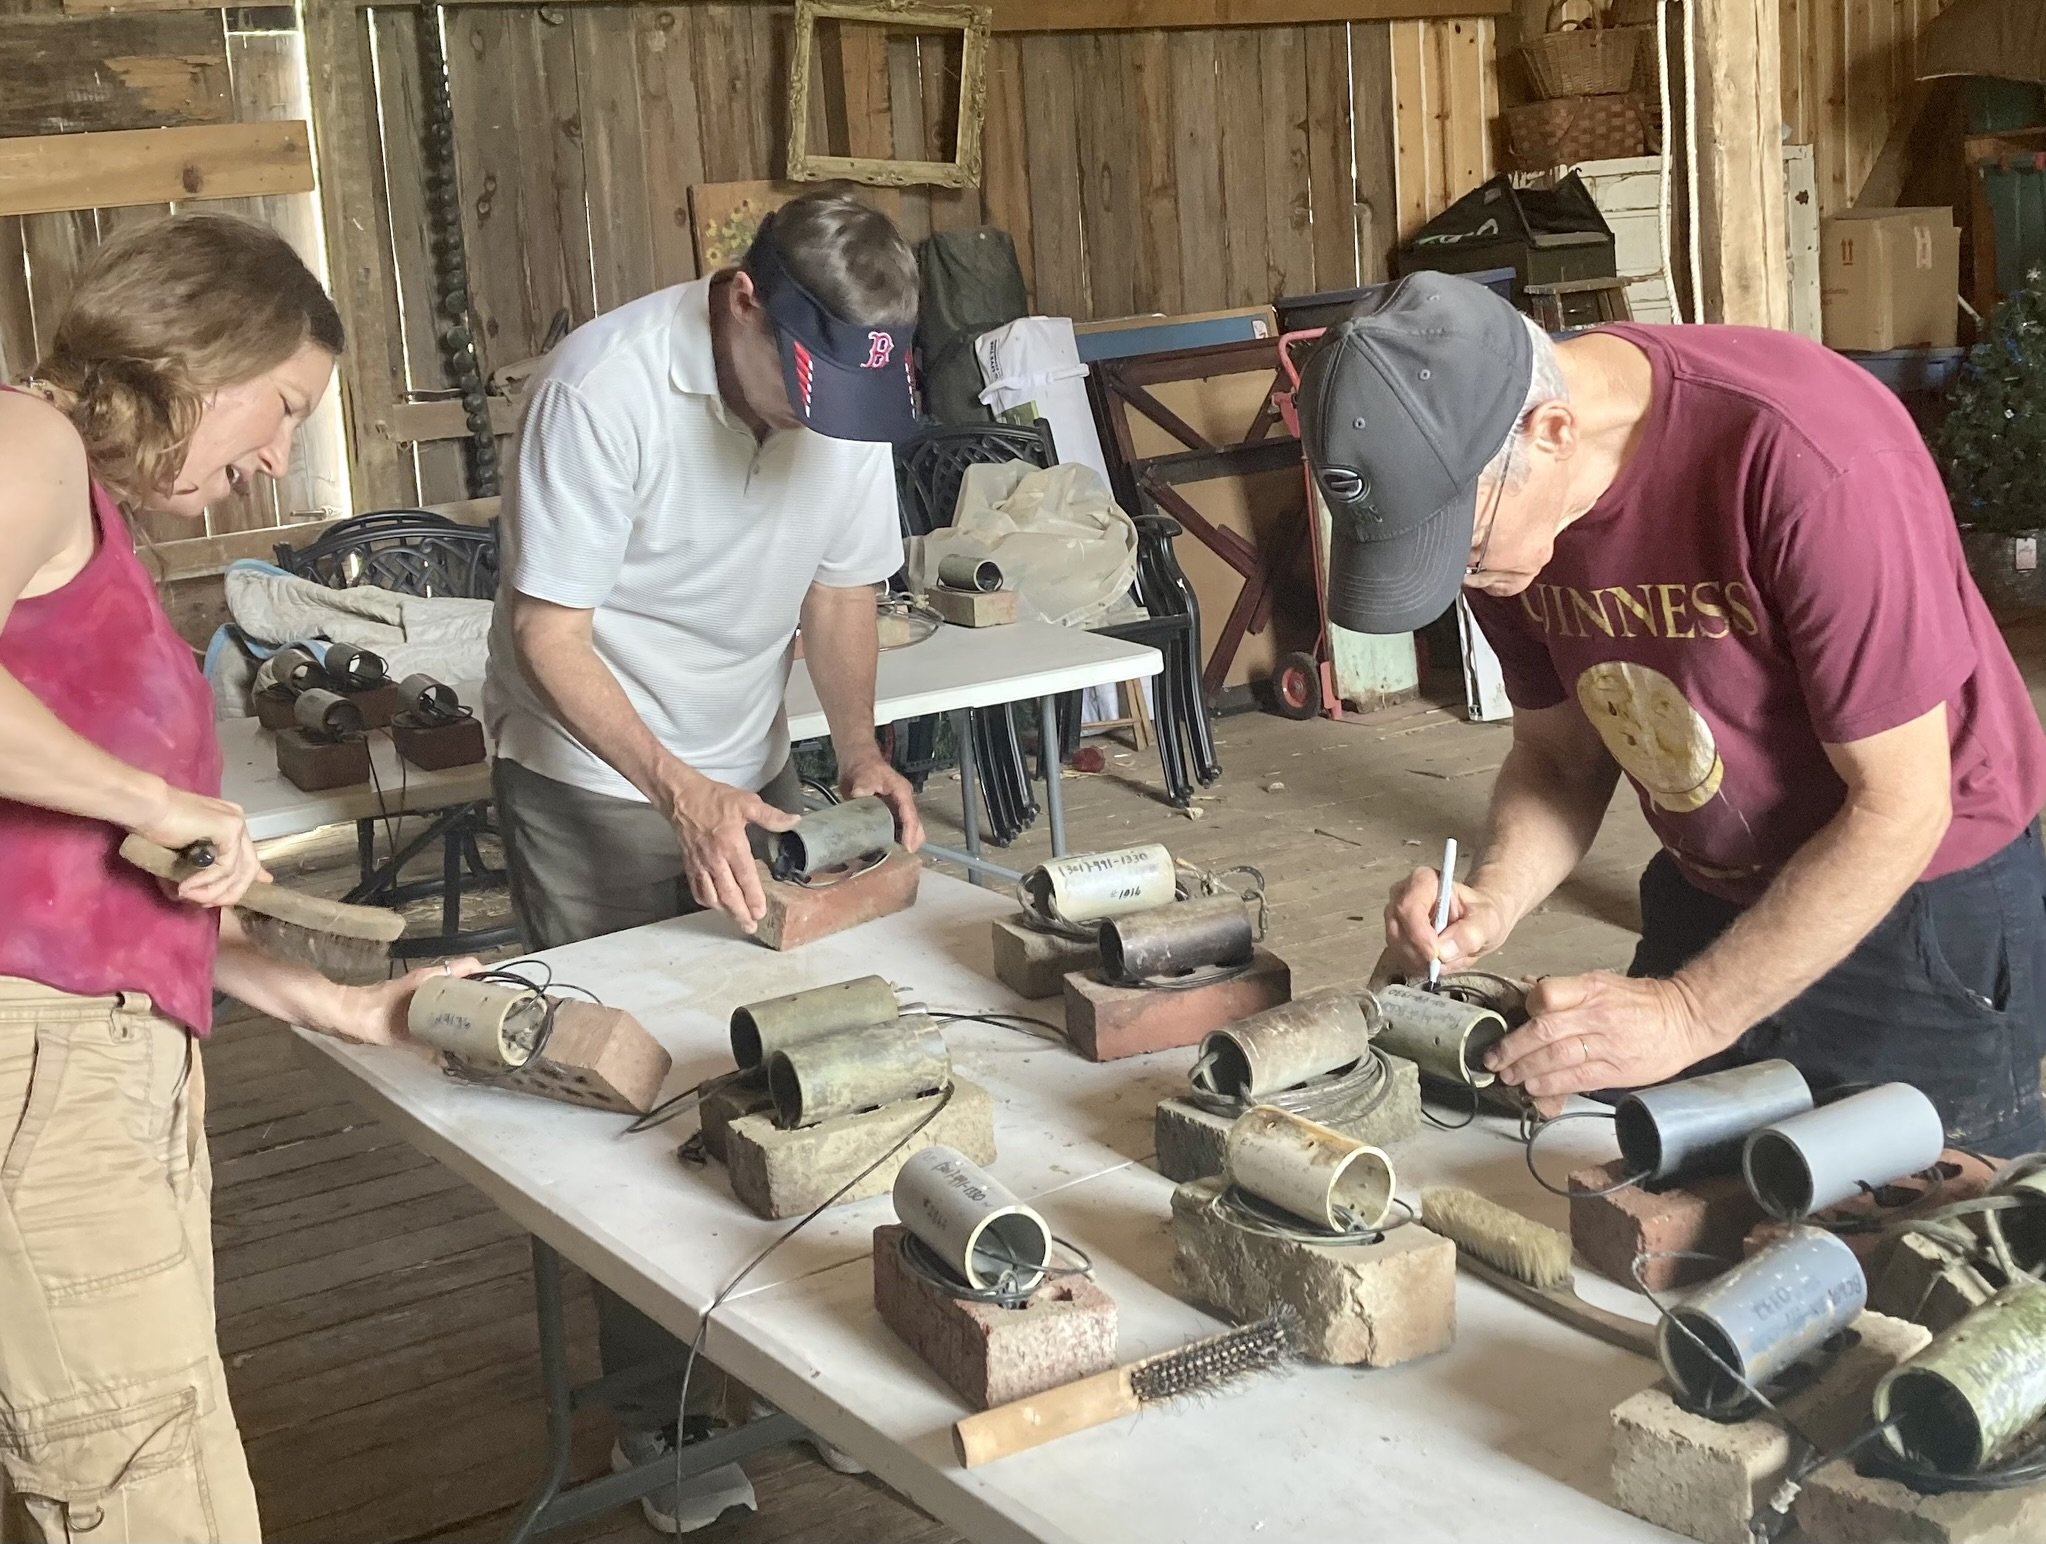
Volunteers prep and deploy temperature logging devices in the summer following the same protocols used by the State of Maryland. Temperature data is collected from June 1 to August 31. The temperature data is then analyzed for comparison to the State criteria for each stream’s “Use Class Designation”. For example, there are three small watersheds withing the Antietam drainage area that are known for coldwater, trout-bearing waters (Use Class III). Average stream temperatures are not exceed 20C (68F) 90% of time during the summer, with the maximum water temperature not to exceed 23.9C.
STREAM TEMPERATURES
Volunteers preparing loggers for deployment to streams
Recent Bacteria Data
From May to September ACWA volunteers help the Potomac Riverkeeper Network collect water samples weekly to measure levels of bacteria (e. coli) at 4 sites around the Antietam watershed.
Learn more about recreating safely with natural waters in: Safe Swimming and Creek Bacteria article. For weekly PRKN bacteria results, visit: www.potomacriverkeepernetwork.org/
Water Quality Data
Our water quality data is uploaded to the Chesapeake Monitoring Cooperative’s (CMC) Chesapeake Data Network website.
New for 2025! Road salt (chlorides) and Nitrate data collected under the IWLA Salt-Watch and Nitrate-Watch program will be submitted and can be viewed on the Clean Water Hub.


