National Water Quality Month: what it means locally
by Byron Madigan, ACWA Board Member & Chair of the MD Water Monitoring Council
Did you know that the month of August is recognized annually as National Water Quality Month?
With its history and origins dating back to the Clean Water Act of 1972 and the Safe Drinking Water Act of 1974, which were pivotal in improving water quality, National Water Quality Month was founded in 2005 by the Environmental Protection Agency (EPA) and the United Nations. This designation was to continue to promote awareness and encourage actions for the conservation and protection of the nation’s water sources by having conversations within our communities on what we can do within our own households and locally to ensure access for all to safe, clean drinking water for our future generations.
When most people think of water quality or the degradation of surface waters, the focus is primarily on pollutants like sediment that increase turbidity within our streams, or on nutrients, such as nitrogen and phosphorus that cause excessive algal blooms and reduce the amount of available oxygen for aquatic organisms. These specific pollutants can originate from a variety of sources, such as fertilizers from lawns, golf courses and agricultural operations, commercial and industrial areas, faulty septic systems, livestock waste, vehicle grease and oil, and other untraceable sources, referred to as “Non-point Source Pollution”.
Additionally, section 502 (6) of the Clean Water Act also considers heat a surface water pollutant, and emerging contaminants, such as temperature, are a known constraint on biotic function within our surface waters. Maryland’s surface waters are grouped into four main use classes according to the unique characteristics of each individual water body. There are two use classes associated with cold water fisheries and include, use III(-P) – Nontidal Cold Water, which are capable of supporting reproducing Brook Trout, and use IV(-P) – Recreational Trout Waters, which support a put and take Trout fishery. (Learn more about MD Stream Use Classes with Interactive map)
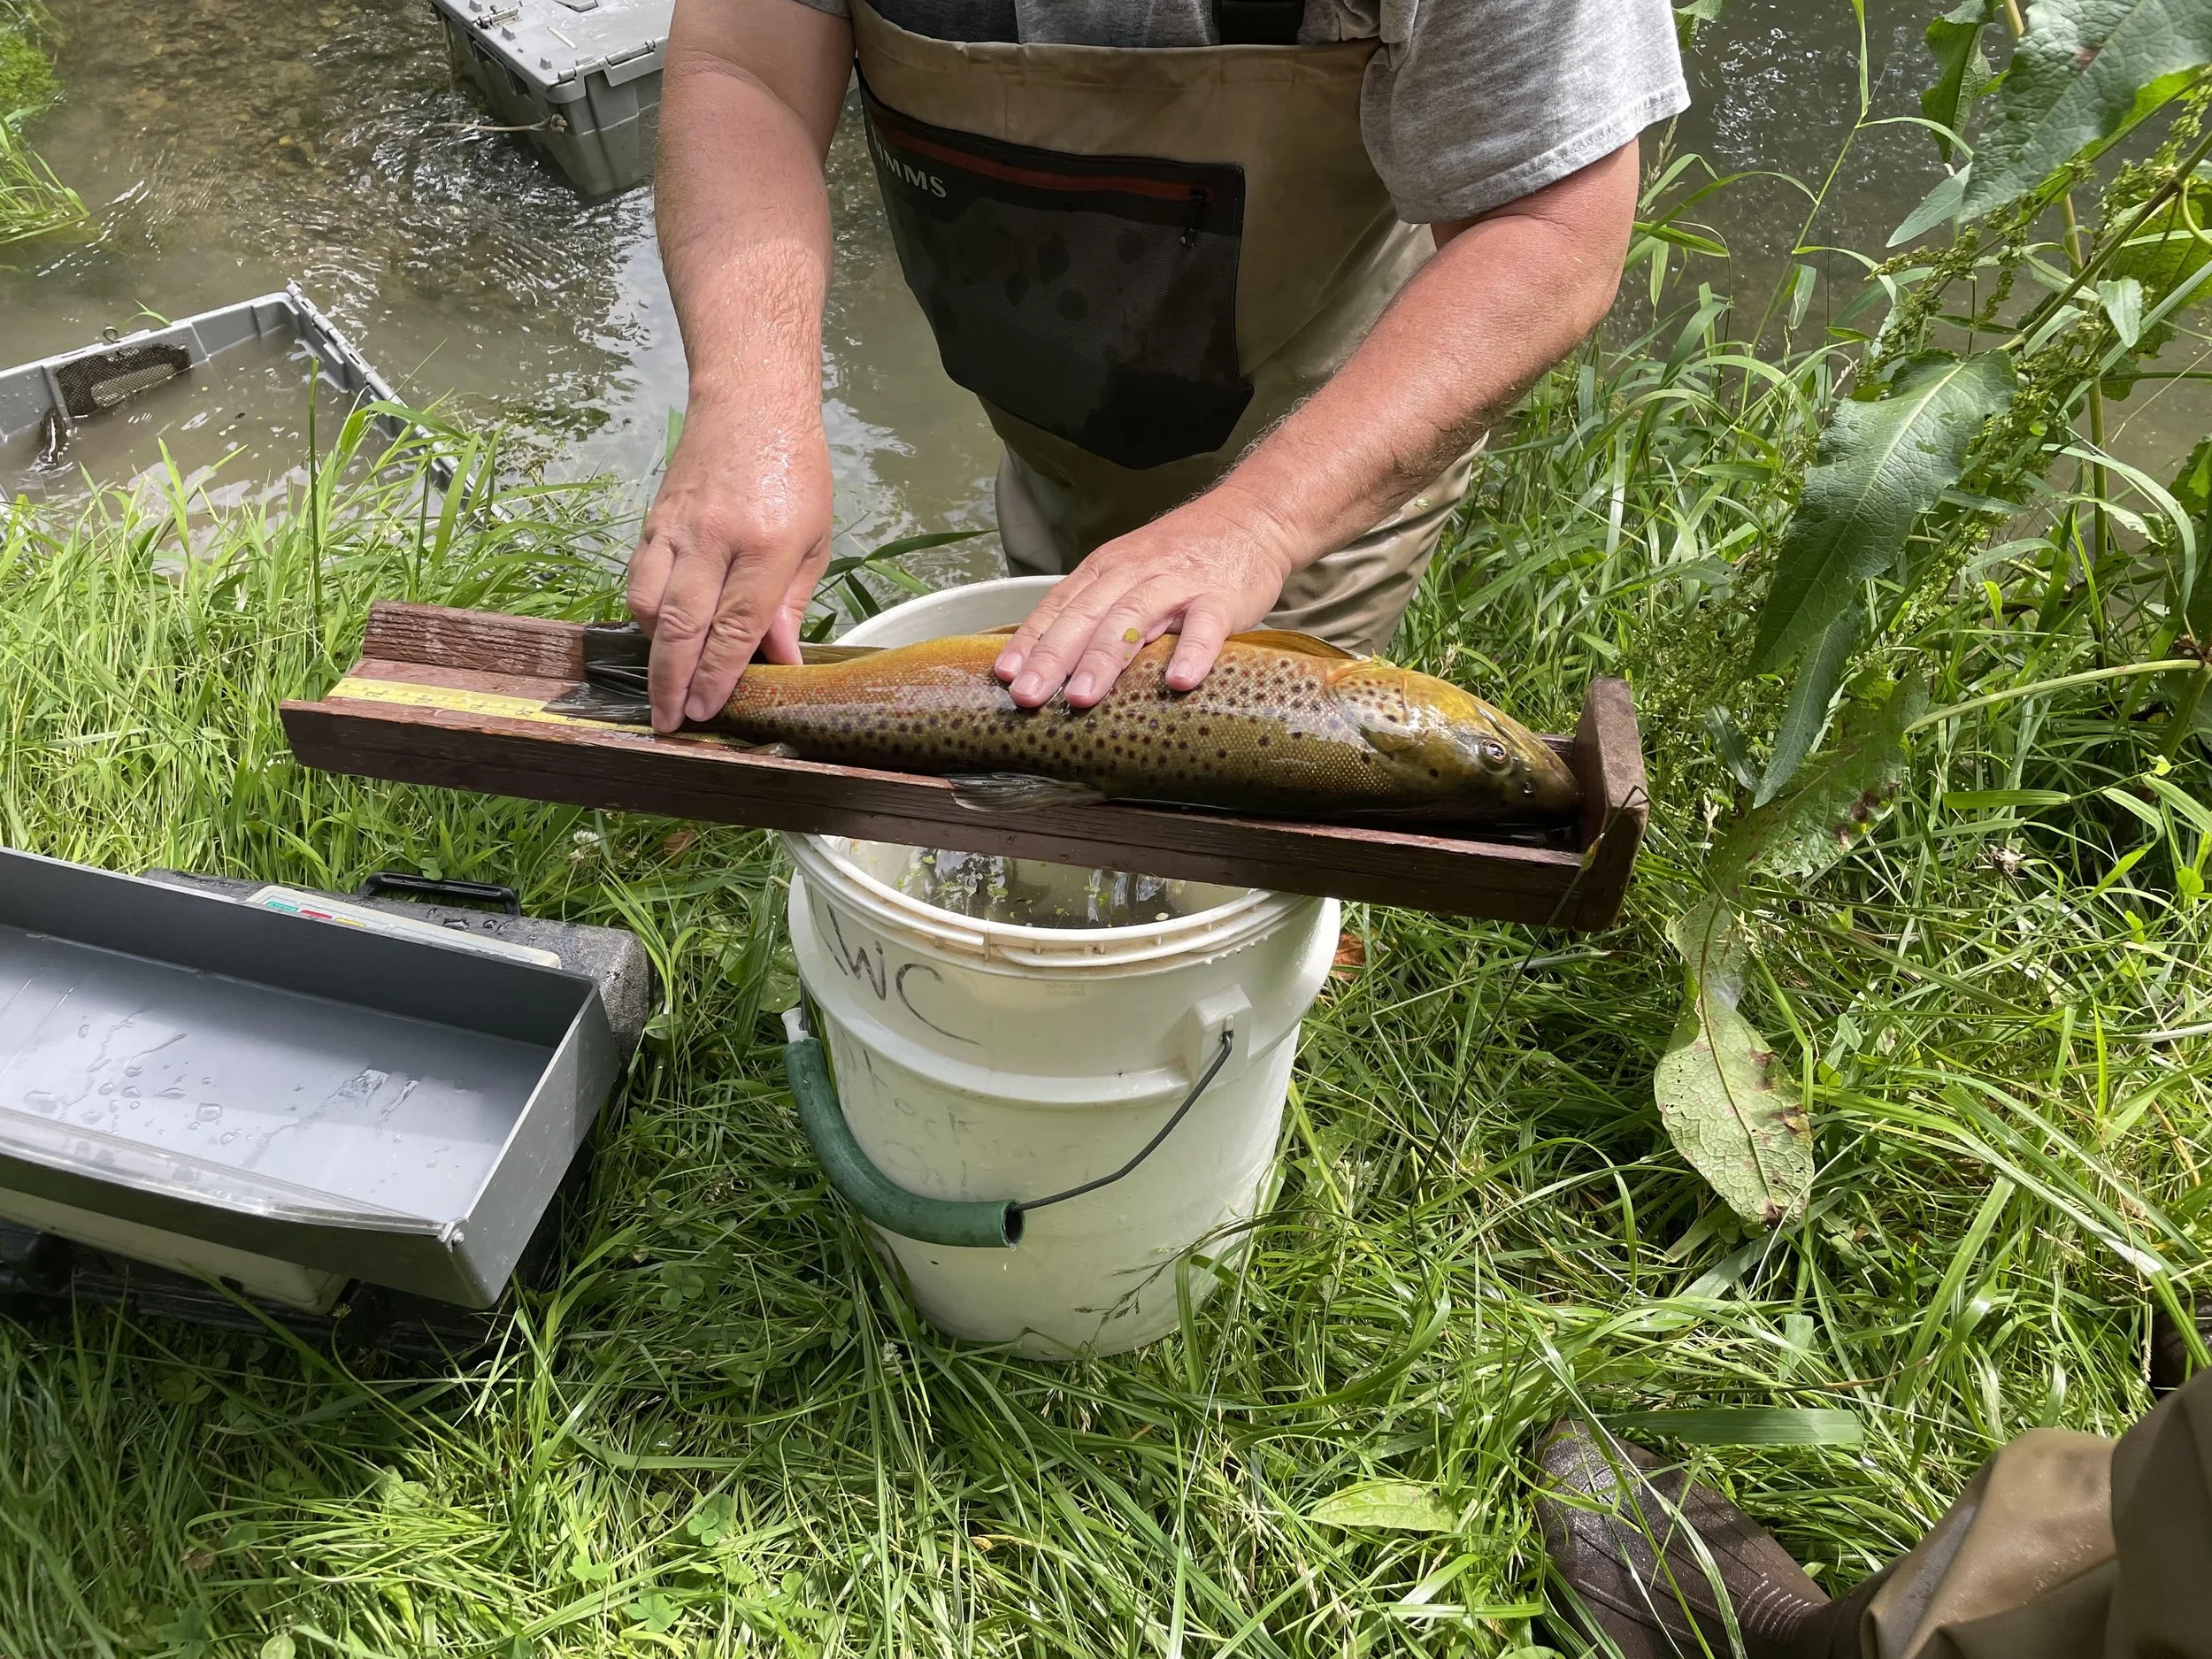
Trout being measured during a MDDNR Fish Survey in Antietam Watershed
Currently Total Maximum Daily Loads (TMDLs) in cold-water designated streams within Maryland are being considered and developed by the Maryland Department of the Environment (MDE) to address temperature concerns.
Within the Maryland portion of the Antietam Creek Watershed, there are approximately 345 stream miles, and greater than 42% of those stream segments (145 miles) are classified as Use III, which are the Nontidal Cold Water, capable of supporting reproducing Brook Trout populations. The temperature criteria established by MDE associated with Use Class III streams may not exceed 68°F or 20°C greater than 90% of the time during the summer months, with no single exceedance greater than 74.8°F or 23.8°C.
Why has stream temperature become more of a concern? In addition to reduced riparian cover and improper agricultural practices, increases in impervious cover (Map 1) from changes in land cover within urbanizing watersheds reduces infiltration and increases the amount of potential thermal energy being absorbed by the impervious cover and transported to our surface waters during storm runoff events.
Structurally designed stormwater facilities typically address nutrient and sediment inputs, but do not necessarily include design elements that address thermal impacts and may ultimately increase stream temperatures throughout the summer months, particularly if these facilities are designed to have a permanent pool of water. Developing thermal solutions in addition to nutrient treatment to address stormwater runoff throughout the summer thermal season could potentially expand what types of BMPs could be available for implementation.
In 2018, ACWA partnered with the Beaver Creek Watershed Association, a 501(c)(3) non-profit organization to create a volunteer monitoring program to measure stream temperatures throughout the Antietam Creek watershed during the summer thermal period (June-August). This effort led to approximately 34 continuous stream sensors being installed at locations within Antietam and Conococheague streams each year by community science volunteers.

Map 1: Antietam Watershed Impervious Surface Cover
Volunteers Monitoring Stream Temperatures
To make this effort possible, each spring, ACWA community science volunteers gather to clean, perform quality control and assemble the temperature sensors that will be deployed during the upcoming thermal monitoring season.
Each sensor is programmed to take a reading every 20 minutes, which is based on State protocols established by Maryland Department of Natural Resources (DNR) for stream temperature monitoring, providing continuous measurements throughout the monitoring period.
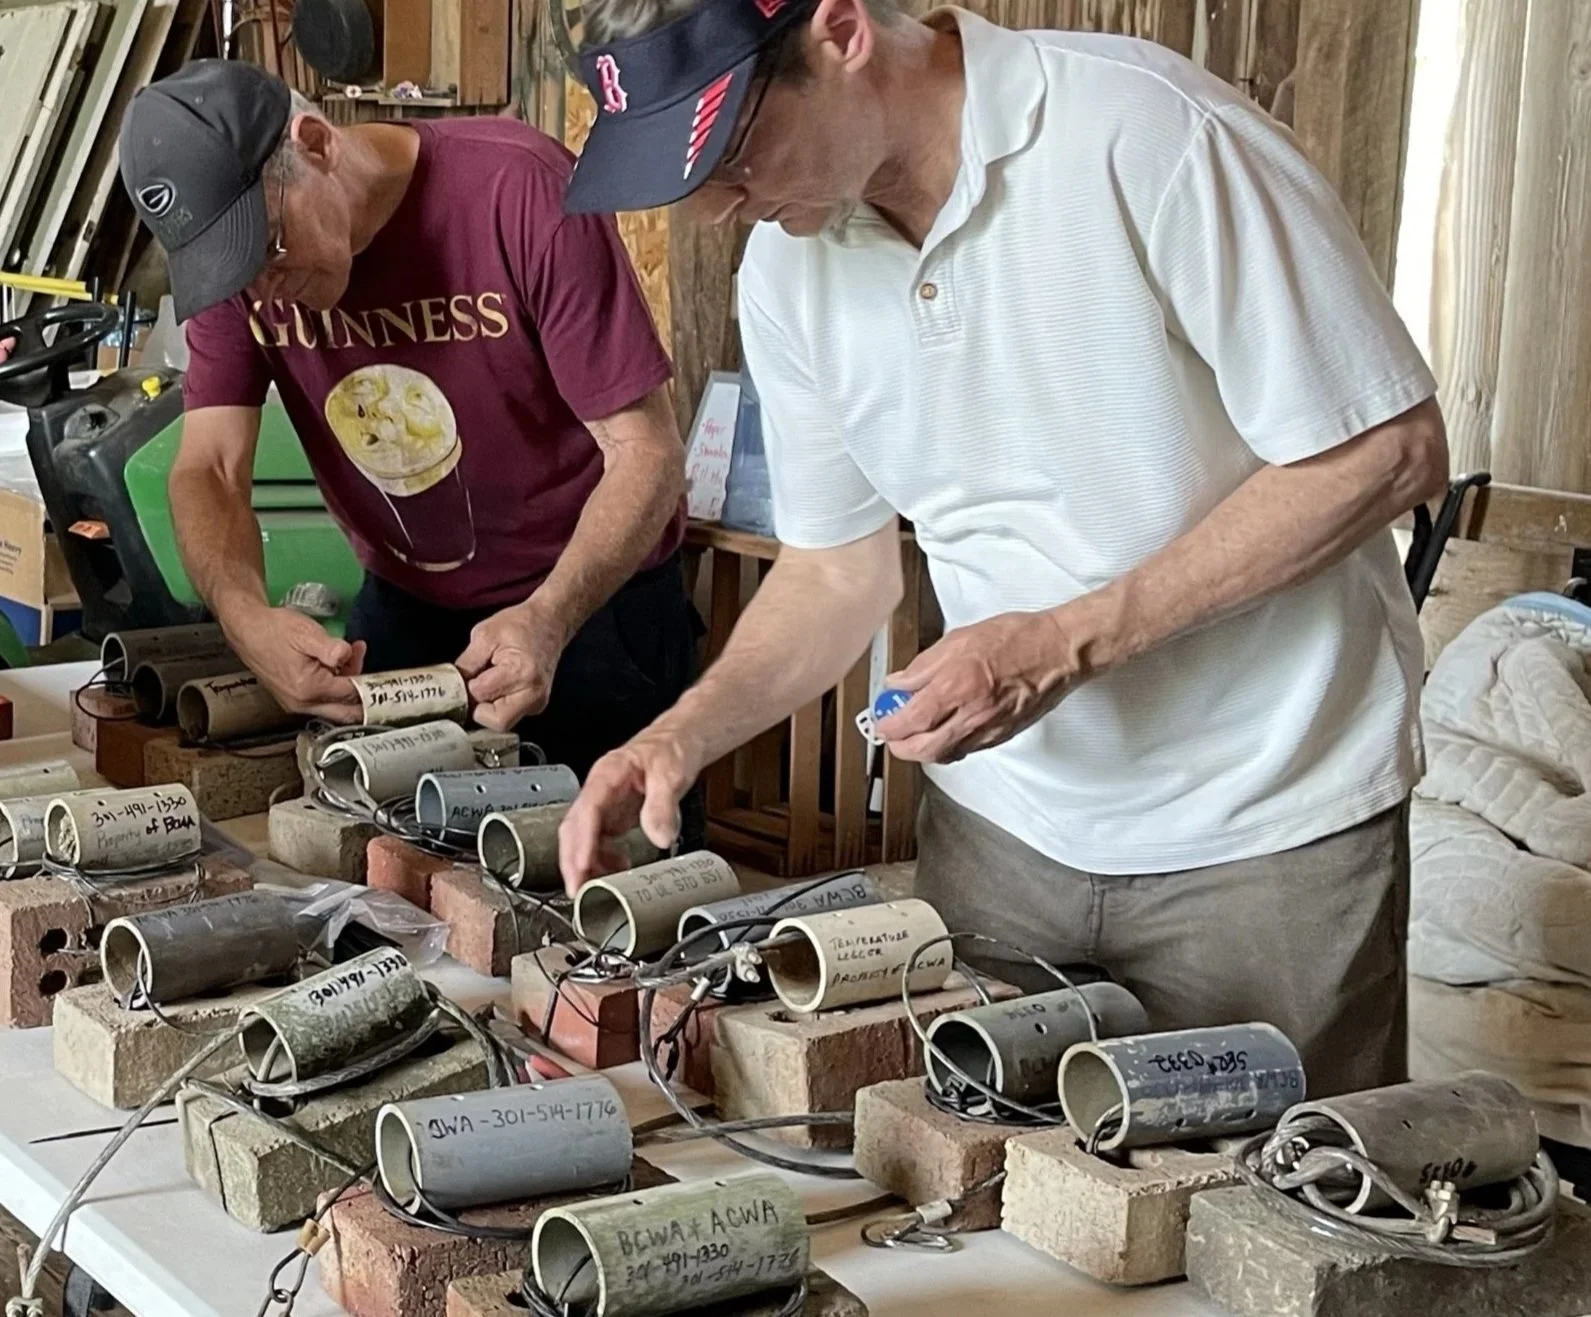
ACWA volunteers prep temperature sensors.
Once the loggers are ready, volunteers install them at the stream monitoring locations prior to the end of May and then each sensor is collected in the fall following the summer monitoring season (See Map 2 for locations). Stream temperature monitoring results are available on the ACWA webpage LINKED HERE. The temperature data collected by volunteers is also shared with the State to include in the MD Integrated Report on Surface Water Quality.
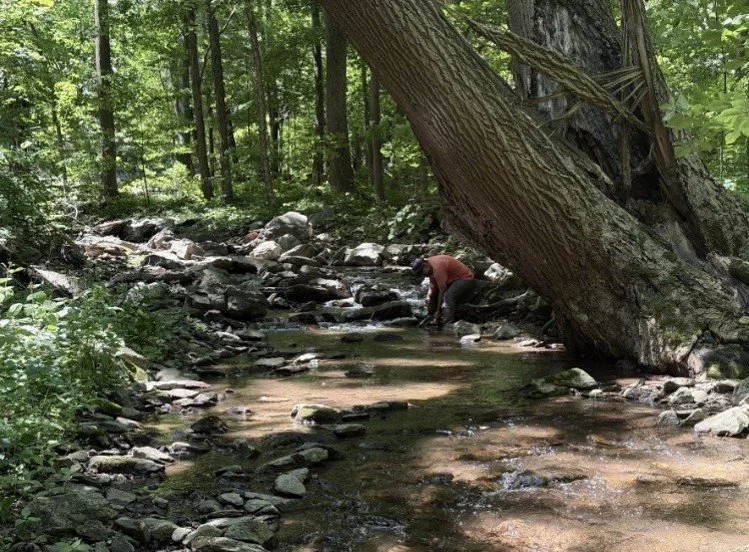
Author Byron Madigan deploying temperature sensors in a stream.
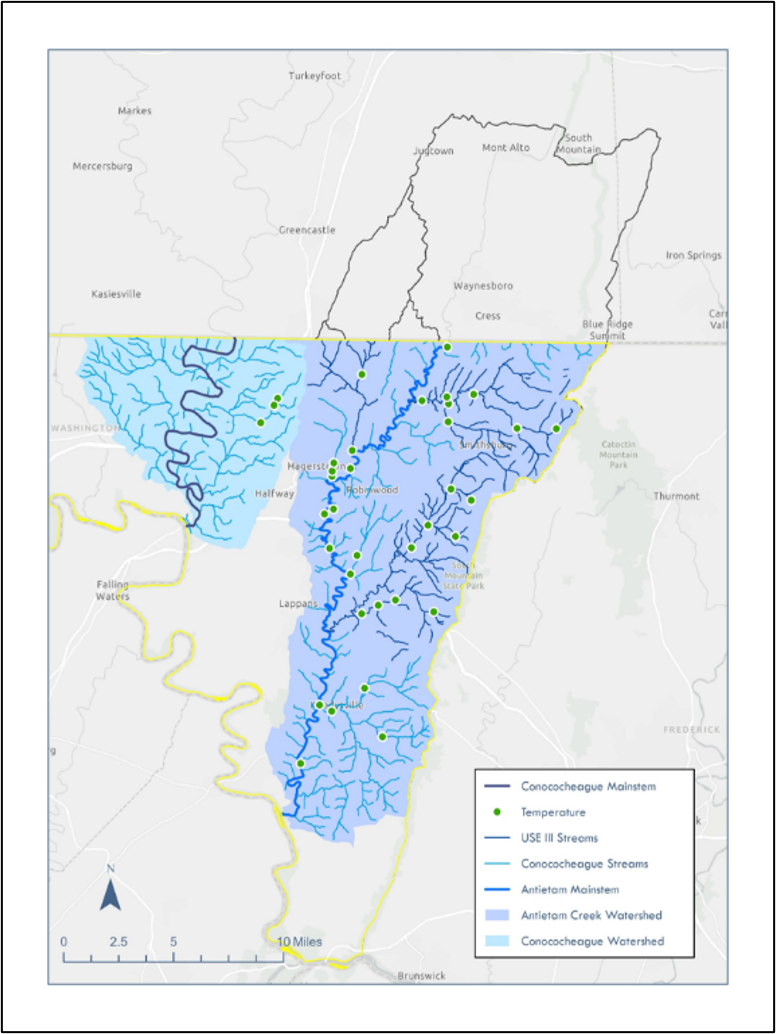
Map 2: General locations of Community Science temperature sensor locations
Whole Watershed Act:
The Whole Watershed Program (WWP) was legislatively established through the Whole Watershed Act (SB 969/HB 1165) in April 2024. This new program was created to provide a highly collaborative, science-based approach to accelerate restoration of the Chesapeake Bay and Atlantic Coastal Bays and their watersheds. The WWP aims at improving watershed health, is a five-year pilot program, targeting five watersheds with the Antietam Watershed being one of the five selected as part of this pilot program.
One component of the WWP will include dedicated money for water quality monitoring, which will be performed by KCI and CRI. Biological Monitoring will be completed at 6 targeted sites associated with a restoration project on Beaver Creek, and 14-20 random sites will be sampled throughout Little Antietam North and Little Antietam South Watersheds (Map 3).
Monitoring for water chemistry will also be collected above and below the Beaver Creek restoration projects and will include 4 automated samplers that will be paired with an area velocity flow module to establish a stage/discharge relationship, as well as flow weighted loadings for Total Nitrogen, Total Phosphorus and Total Suspended Solids.
Monitoring under the WWP will help guide the selection of future stream restoration projects to reduce inputs of non-point pollutants.
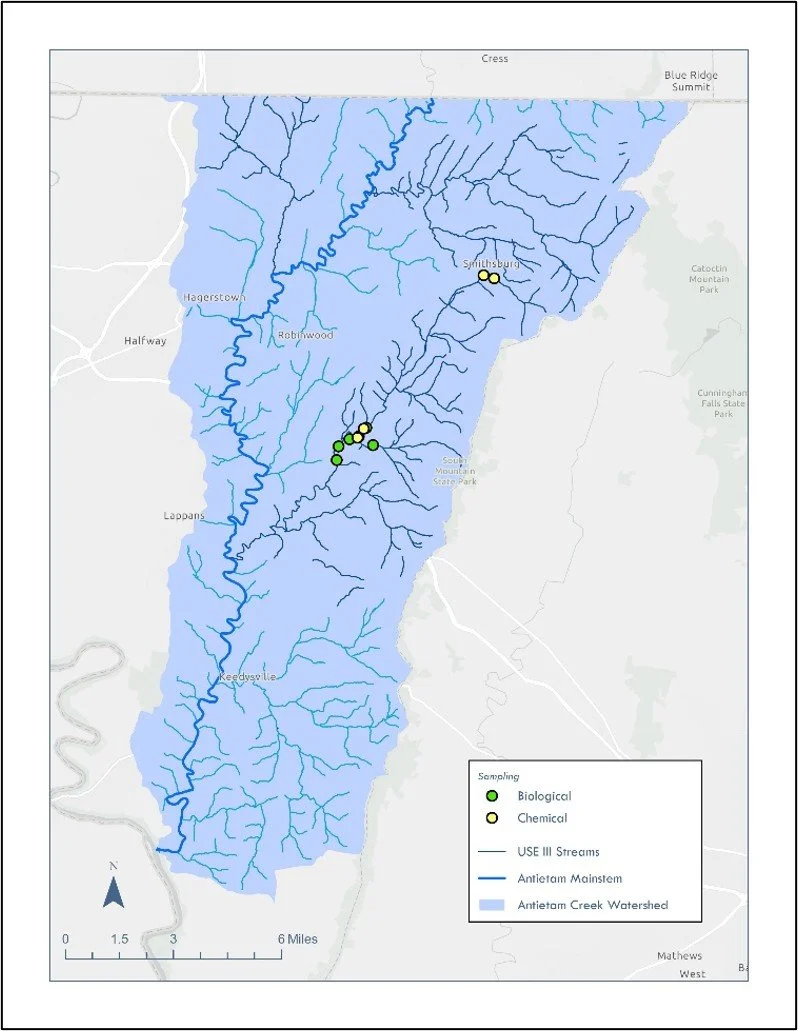
Map 3: Whole Watershed Act Monitoring Locations
To learn more or get involved with volunteer water quality efforts in our regions, refer to the following links:
If you are a landowner in the Antietam Watershed interested in stream restoration or tree planting on your property under the WWP, contact the Catoctin Land Trust.